Code
Animated_MOVIES <- read.csv('Animation_Movies.csv')

#convert dates to date objects
Animated_MOVIES$release_date <- as.Date(Animated_MOVIES$release_date, format = "%Y-%m-%d")Questions for Movie Data:
Animated_MOVIES <- read.csv('Animation_Movies.csv')
#convert dates to date objects
Animated_MOVIES$release_date <- as.Date(Animated_MOVIES$release_date, format = "%Y-%m-%d")#Let's make a graph that looks at the number of movies made in each country and colors them by a number gradient. Also maybe make a popup on hover. I could add information about budget over some time period (last 15 years?).
MOVIES_Q2_1 <- Animated_MOVIES %>%
filter(!(grepl(",", production_countries))) %>%
group_by(production_countries) %>%
summarise(NumMovies = n())#Pixar Budgets
#Let's make a graph tracking the rise in budget for different companies over time. Hoe do I make multiple graphs layout nicely next to each other. Let's start with just one graph...
MOVIES_Q1_1 <- Animated_MOVIES %>%
filter(grepl("Pixar", production_companies)) %>%
filter(runtime > 40) %>%
filter(runtime < 140) %>%
filter(budget > 0)
ggplot(MOVIES_Q1_1, aes(x = reorder(title, +release_date), y = budget/1e6, fill = budget/1e6)) +
geom_bar(stat = "identity") +
coord_flip() +
labs(title = "Pixar Movies",
x = "Movies",
y = "Budget (Millions)",
fill = "") +
#geom_text(aes(label = title), hjust = +1, color = "lightyellow") +
theme(panel.background = element_rect(fill = "lightyellow"),
panel.grid = element_blank(),
axis.text.x = element_text(angle = 0, hjust = 0),
plot.title = element_text(hjust = 0.1)) +
scale_fill_gradient(low = "blue", high = "green")+
theme(axis.text.x = element_text(angle = 0, hjust = 0.5, size = 9, color = "black"),
axis.text.y = element_text(angle = 0, hjust = 1, size = 9, color = "black"))+
theme(legend.title = element_text(size = 12, color = "black"),
legend.text = element_text(size = 9, color = "black"),
legend.position = "bottom")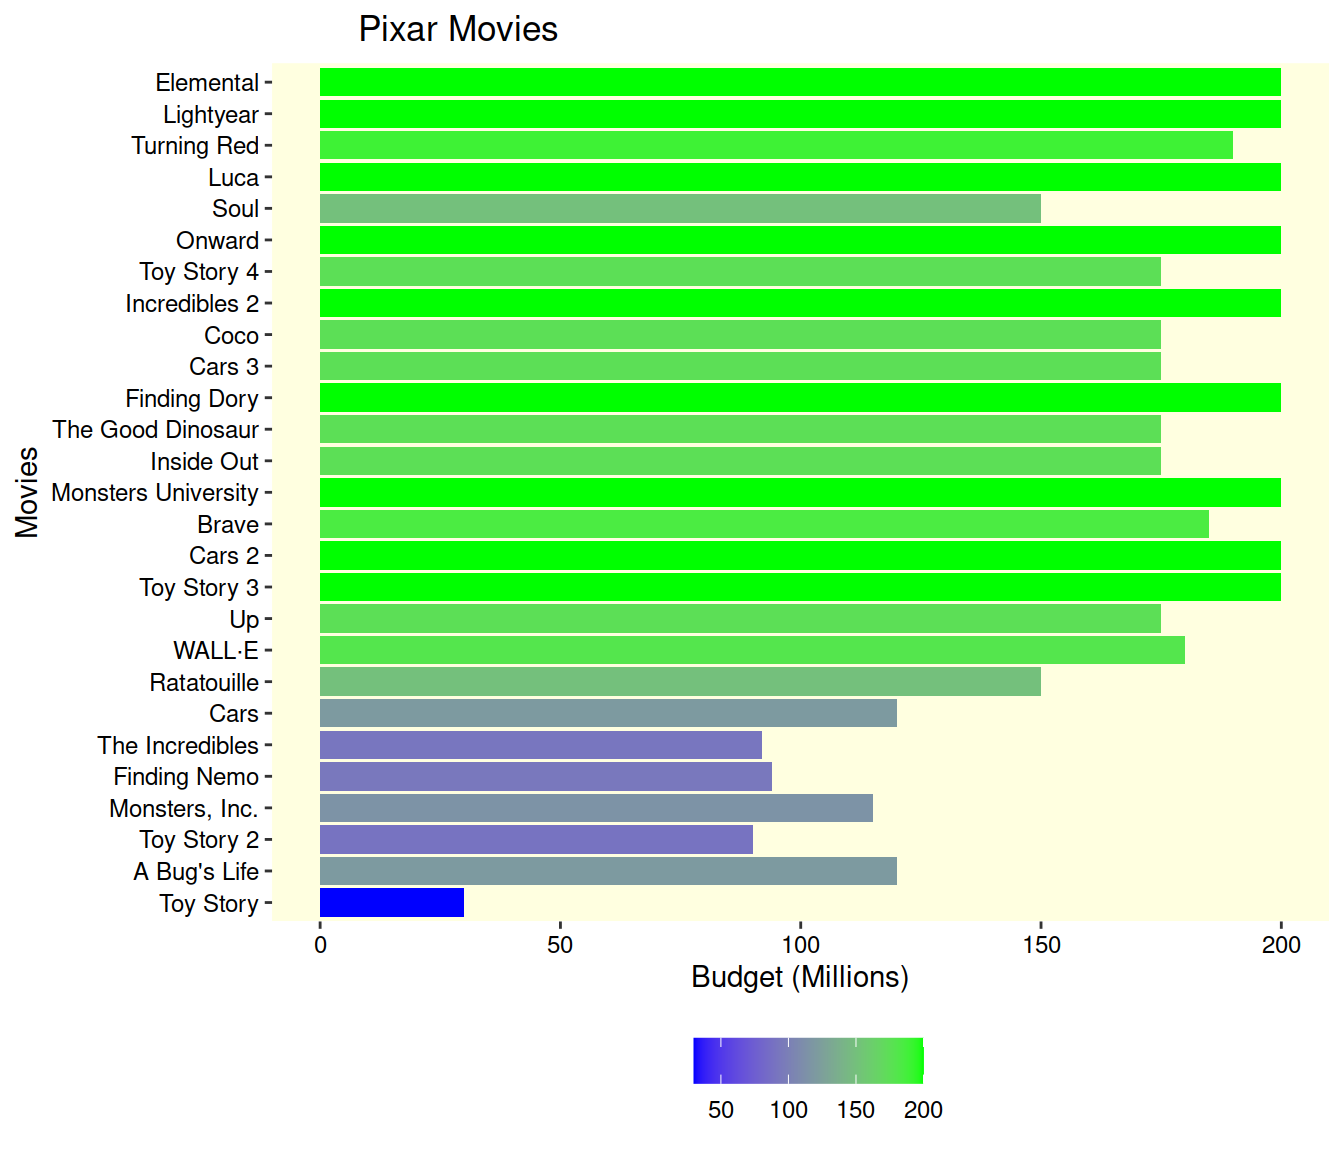
#Studio Ghibli Budgets

MOVIES_Q1_2 <- Animated_MOVIES %>%
  filter(grepl("Studio Ghibli", production_companies)) %>%
  filter(runtime > 20) %>%
  filter(runtime < 140) %>%
  filter(budget > 0)

ggplot(MOVIES_Q1_2, aes(x = reorder(title, +release_date), y = budget/1e6, fill = budget/1e6)) +
  geom_bar(stat = "identity") +
  coord_flip() +
  labs(title = "Studio Ghibli Movies",
       x = "Movies",
       y = "Budget (Millions)",
       fill = "") +
  #geom_text(aes(label =  title), hjust = +1, color = "lightyellow") +
  theme(panel.background = element_rect(fill = "lightyellow"),
        panel.grid = element_blank(),
        axis.text.x = element_text(angle = 90, hjust = 0),
        plot.title = element_text(hjust = 0.1))+
  scale_fill_gradient(low = "blue", high = "violet")+
  theme(axis.text.x = element_text(angle = 0, hjust = 0.5, size = 9, color = "black"),
        axis.text.y = element_text(angle = 0, hjust = 1, size = 9, color = "black"))+
  theme(legend.title = element_text(size = 12, color = "black"),
        legend.text = element_text(size = 9, color = "black"),
        legend.position = "bottom")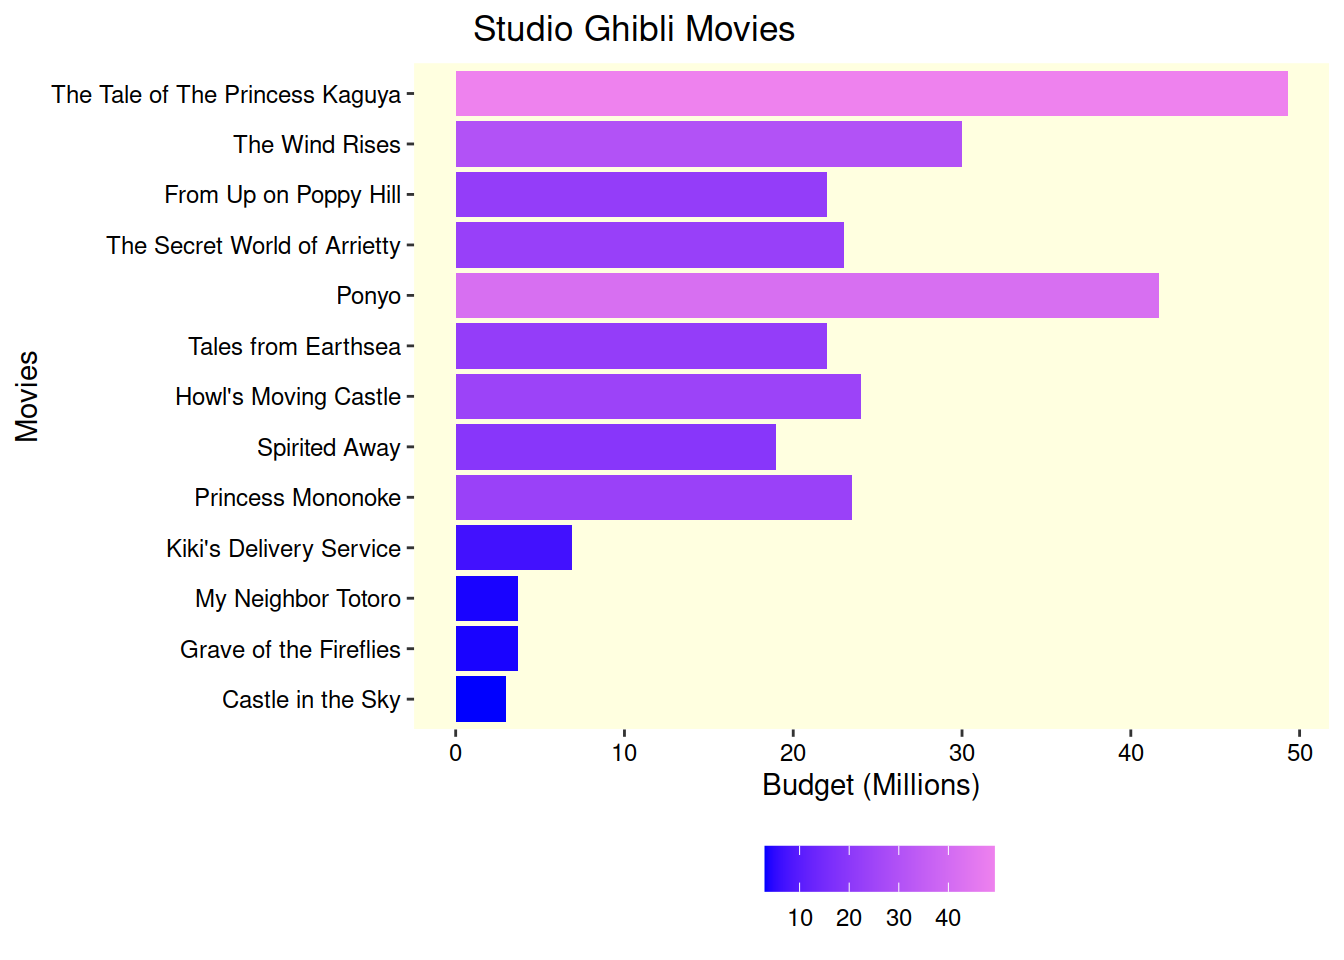
#DreamWorks Budgets

MOVIES_Q1_3 <- Animated_MOVIES %>%
  filter(grepl("DreamWorks", production_companies)) %>%
  filter(runtime > 40) %>%
  filter(runtime < 140) %>%
  filter(budget > 0)

ggplot(MOVIES_Q1_3, aes(x = reorder(title, +release_date), y = budget/1e6, fill = budget/1e6)) +
  geom_bar(stat = "identity") +
  coord_flip() +
  labs(title = "DreamWorks Movies",
       x = "Movies",
       y = "Budget",
       fill = "") +
  #geom_text(aes(label =  title), hjust = +1, color = "lightyellow") +
  theme(panel.background = element_rect(fill = "lightyellow"),
        panel.grid = element_blank(),
        axis.text.x = element_text(angle = 90, hjust = 0),
        plot.title = element_text(hjust = 0.1))+
  scale_fill_gradient(low = "navy", high = "lightgreen")+
  theme(axis.text.x = element_text(angle = 0, hjust = 0.5, size = 9, color = "black"),
        axis.text.y = element_text(angle = 0, hjust = 1, size = 9, color = "black"))+
  theme(legend.title = element_text(size = 12, color = "black"),
        legend.text = element_text(size = 9, color = "black"),
        legend.position = "bottom")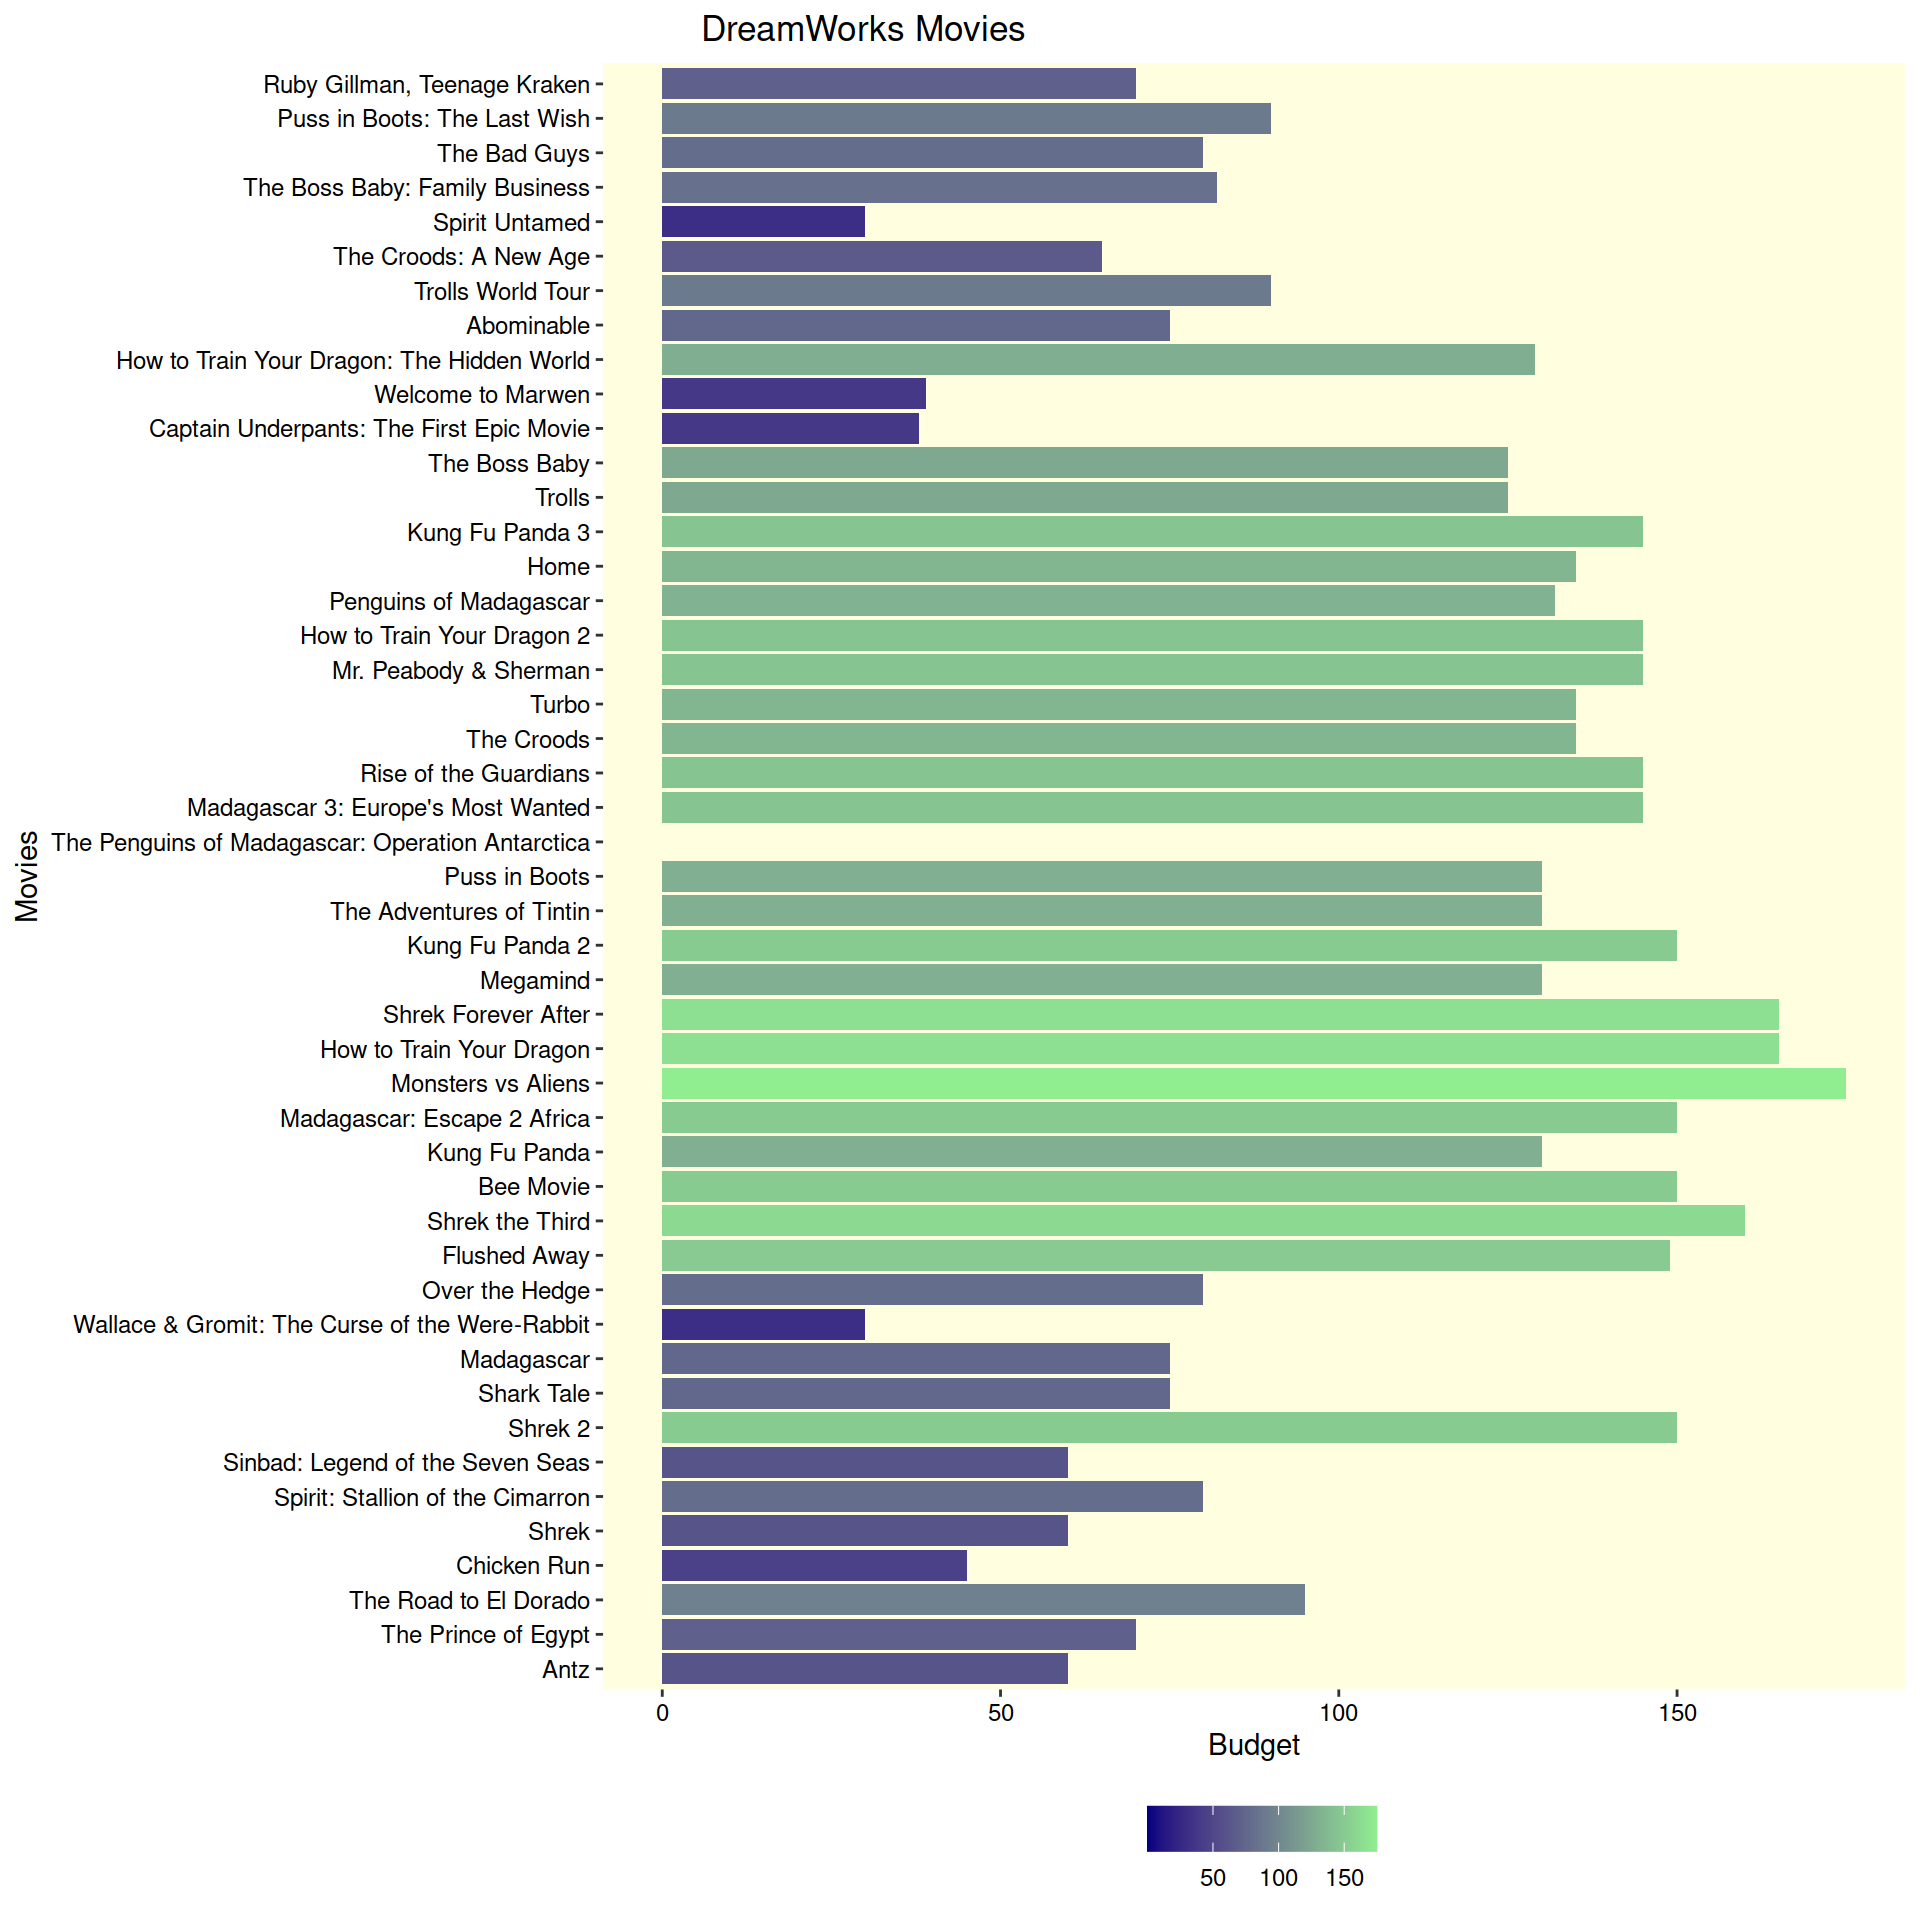
#Disney

MOVIES_Q1_4 <- Animated_MOVIES %>%
  filter(grepl("Walt Disney P", production_companies) & !(grepl("Pixar", production_companies)) & !(grepl("Studio Ghibli", production_companies))) %>%
  filter(runtime > 40) %>%
  filter(runtime < 140) %>%
  filter(budget > 0)

ggplot(MOVIES_Q1_4, aes(x = reorder(title, +release_date), y = budget/1e6, fill = budget/1e6)) +
  geom_bar(stat = "identity") +
  coord_flip() +
  labs(title = "Disney Movies",
       x = "Movies",
       y = "Budget",
       fill = "") +
  #geom_text(aes(label =  title), hjust = +1, color = "lightyellow") +
  theme(panel.background = element_rect(fill = "lightyellow"),
        panel.grid = element_blank(),
        axis.text.x = element_text(angle = 90, hjust = 0),
        plot.title = element_text(hjust = 0.1))+
  scale_fill_gradient(low = "navy", high = "pink")+
  theme(axis.text.x = element_text(angle = 0, hjust = 0.5, size = 9, color = "black"),
        axis.text.y = element_text(angle = 0, hjust = 1, size = 9, color = "black"))+
  theme(legend.title = element_text(size = 12, color = "black"),
        legend.text = element_text(size = 9, color = "black"),
        legend.position = "bottom")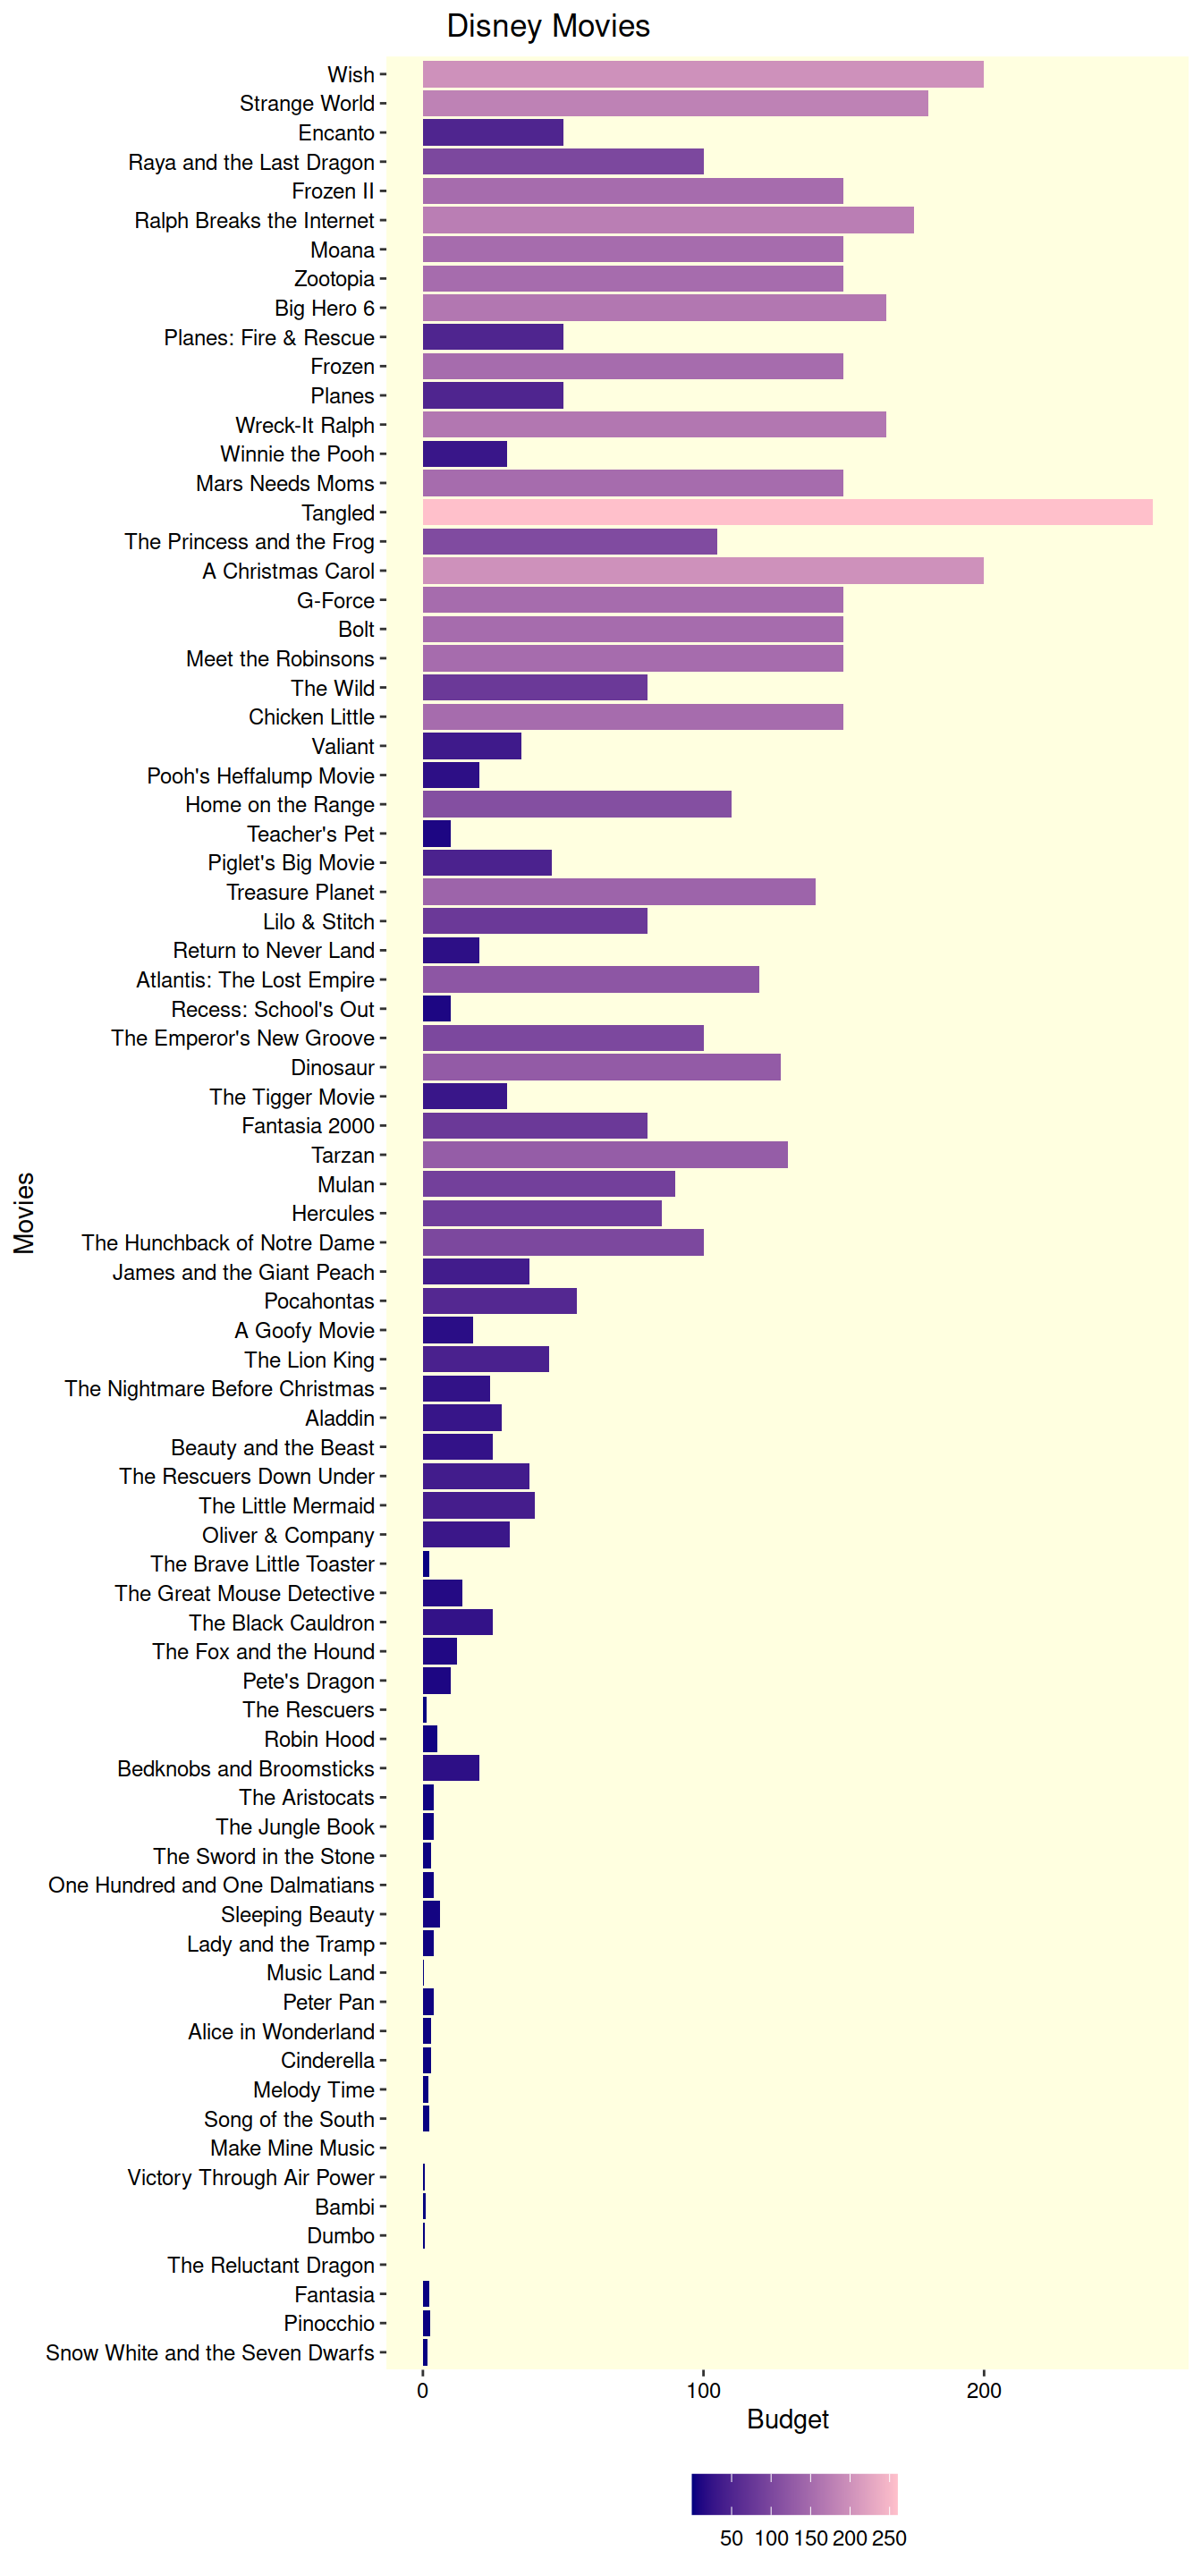
#Illumination Budgets

MOVIES_Q1_5 <- Animated_MOVIES %>%
  filter(grepl("Illumination", production_companies)) %>%
  filter(runtime > 40) %>%
  filter(runtime < 140) %>%
  filter(budget > 0)

ggplot(MOVIES_Q1_5, aes(x = reorder(title, +release_date), y = budget/1e6, fill = budget/1e6)) +
  geom_bar(stat = "identity") +
  coord_flip() +
  labs(title = "Illumination Movies",
       x = "Movies",
       y = "Budget",
       fill = "") +
  #geom_text(aes(label =  title), hjust = +1, color = "lightyellow") +
  theme(panel.background = element_rect(fill = "lightyellow"),
        panel.grid = element_blank(),
        axis.text.x = element_text(angle = 90, hjust = 0),
        plot.title = element_text(hjust = 0.1))+
  scale_fill_gradient(low = "darkgreen", high = "gold")+
  theme(axis.text.x = element_text(angle = 0, hjust = 0.5, size = 9, color = "black"),
        axis.text.y = element_text(angle = 0, hjust = 1, size = 9, color = "black"))+
  theme(legend.title = element_text(size = 12, color = "black"),
        legend.text = element_text(size = 9, color = "black"),
        legend.position = "bottom")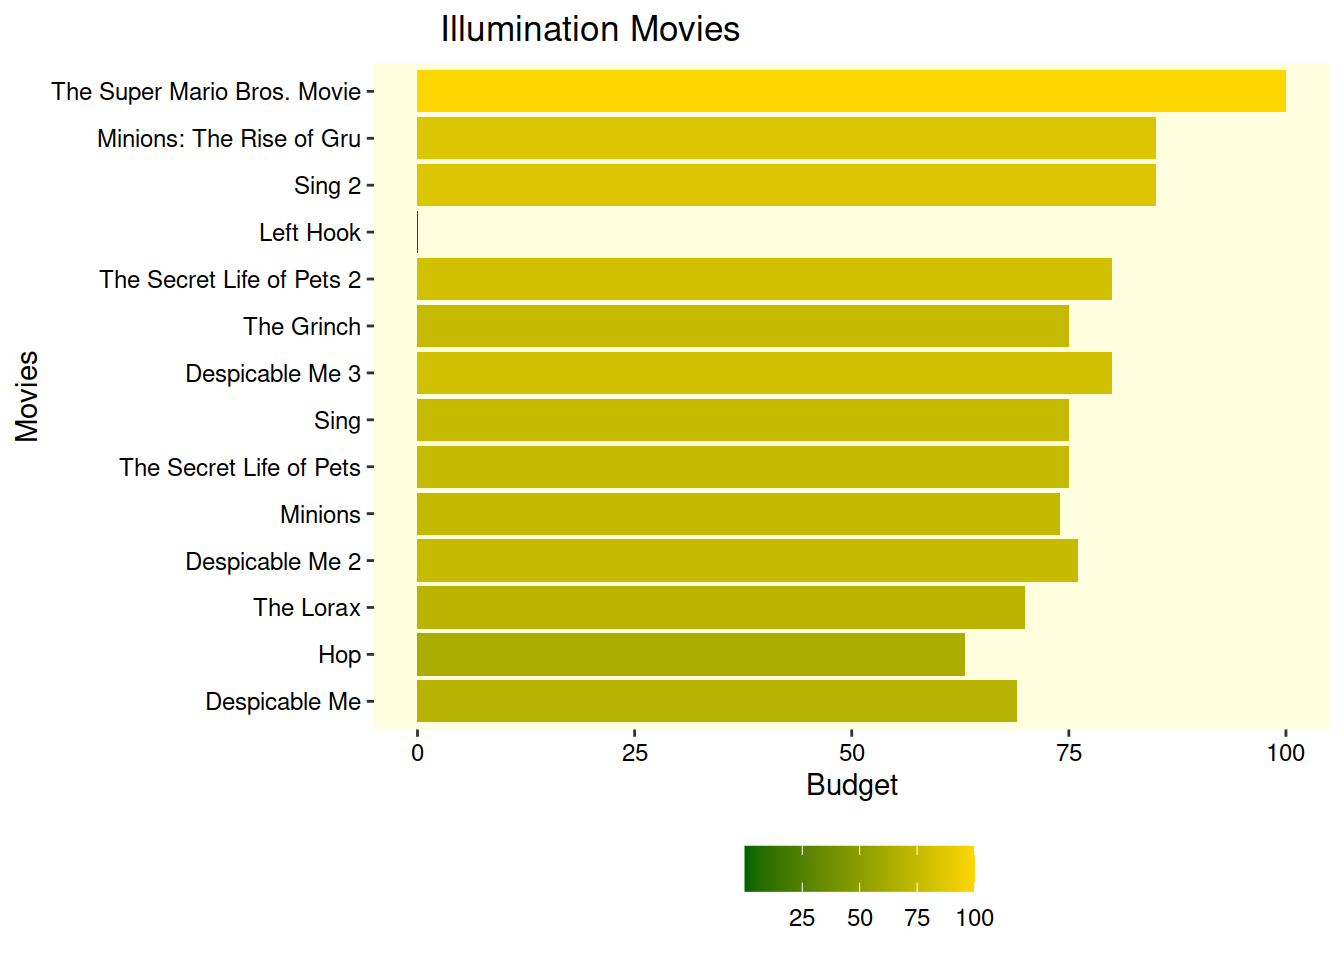
#Blue Sky Budgets

MOVIES_Q1_6 <- Animated_MOVIES %>%
  filter(grepl("Blue Sky", production_companies)) %>%
  filter(runtime > 40) %>%
  filter(runtime < 140) %>%
  filter(budget > 0)

ggplot(MOVIES_Q1_6, aes(x = reorder(title, +release_date), y = budget/1e6, fill = budget/1e6)) +
  geom_bar(stat = "identity") +
  coord_flip() +
  labs(title = "Blue Sky Movies",
       x = "Movies",
       y = "Budget",
       fill = "") +
  #geom_text(aes(label =  title), hjust = +1, color = "lightyellow") +
  theme(panel.background = element_rect(fill = "lightyellow"),
        panel.grid = element_blank(),
        axis.text.x = element_text(angle = 90, hjust = 0),
        plot.title = element_text(hjust = 0.1))+
  scale_fill_gradient(low = "purple", high = "yellow")+
  theme(axis.text.x = element_text(angle = 0, hjust = 0.5, size = 9, color = "black"),
        axis.text.y = element_text(angle = 0, hjust = 1, size = 9, color = "black"))+
  theme(legend.title = element_text(size = 12, color = "black"),
        legend.text = element_text(size = 9, color = "black"),
        legend.position = "bottom")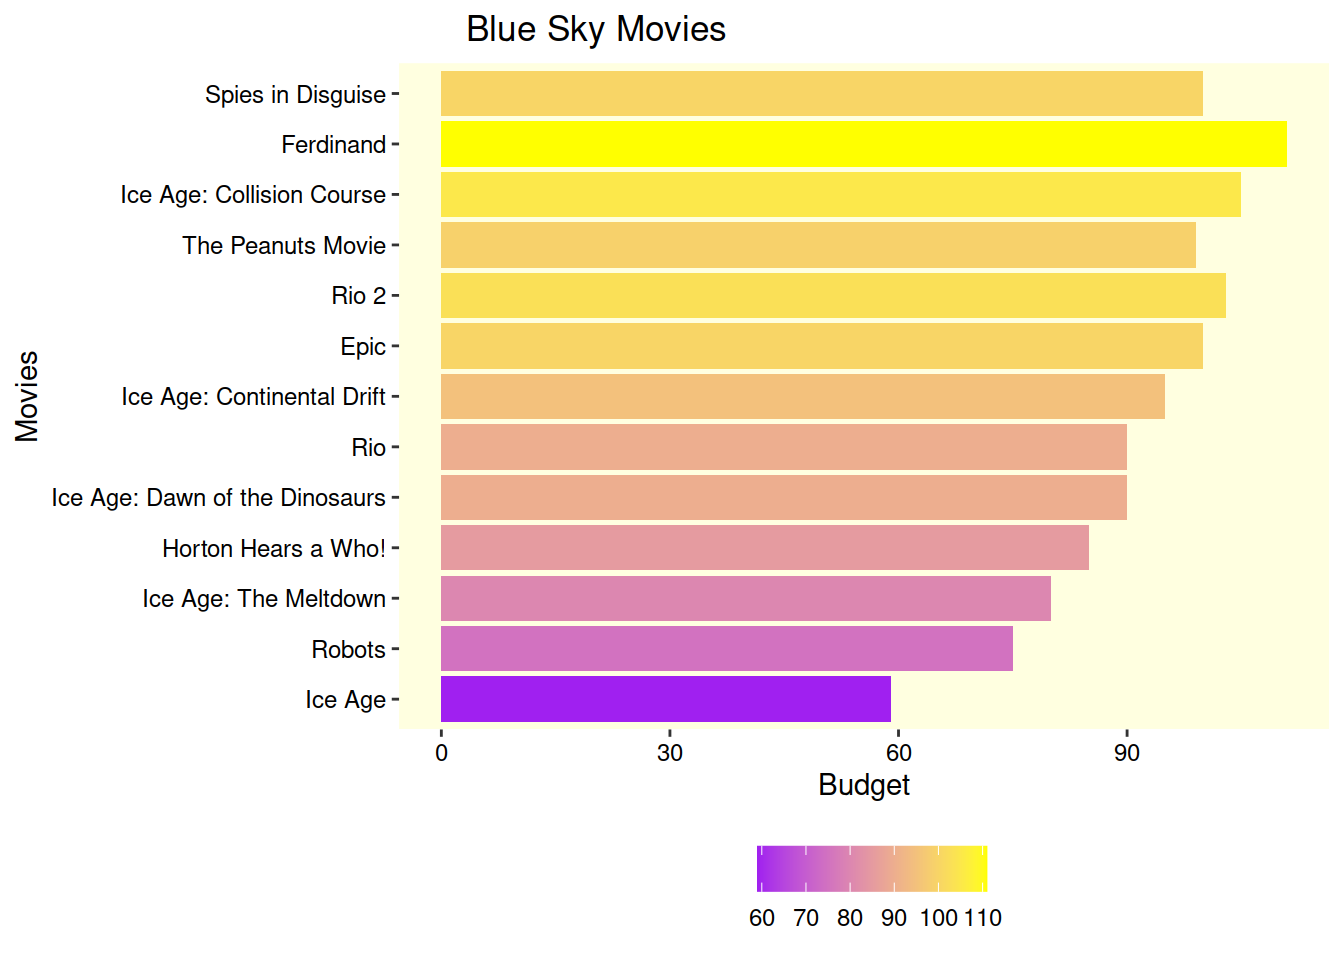
#Sony Budgets

MOVIES_Q1_7 <- Animated_MOVIES %>%
  filter(grepl("Sony Pictures Animation", production_companies)) %>%
  filter(runtime > 40) %>%
  filter(runtime < 140) %>%
  filter(budget > 0)

ggplot(MOVIES_Q1_7, aes(x = reorder(title, +release_date), y = budget/1e6, fill = budget/1e6)) +
  geom_bar(stat = "identity") +
  coord_flip() +
  labs(title = "Sony Movies",
       x = "Movies",
       y = "Budget",
       fill = "") +
  #geom_text(aes(label =  title), hjust = +1, color = "lightyellow") +
  theme(panel.background = element_rect(fill = "lightyellow"),
        panel.grid = element_blank(),
        axis.text.x = element_text(angle = 90, hjust = 0),
        plot.title = element_text(hjust = 0.1)) +
  scale_fill_gradient(low = "blue", high = "orange")+
  theme(axis.text.x = element_text(angle = 0, hjust = 0.5, size = 9, color = "black"),
        axis.text.y = element_text(angle = 0, hjust = 1, size = 9, color = "black"))+
  theme(legend.title = element_text(size = 12, color = "black"),
        legend.text = element_text(size = 9, color = "black"),
        legend.position = "bottom")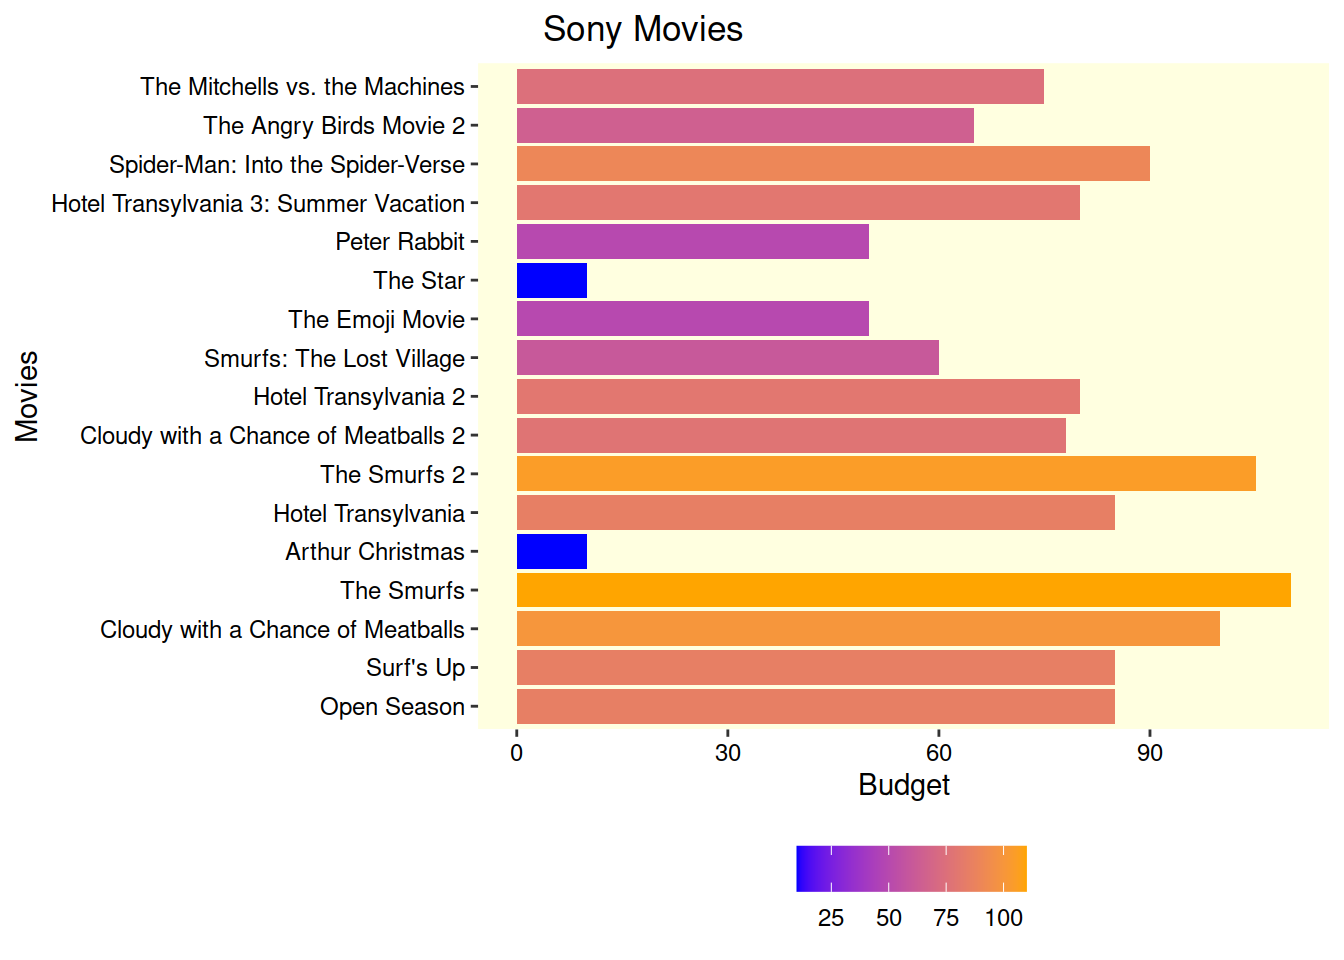
Movie Budgets and Revenue Over Time
#comparing all budgets

Studios <- c('Disney', 'DreamWorks', "Pixar", "Studio Ghibli", "Illumination", "Sony Animation")
Studio_Colors <- c('Disney' = 'red', 'DreamWorks'= 'blue', "Pixar" = 'lightgreen', "Studio Ghibli" = 'violet', "Illumination" = 'gold', "Sony Animation" = 'brown' )

#Grouping data by school and filtering by date and agency
MOVIES_Q1_A <- Animated_MOVIES %>%
  filter(runtime > 40) %>%
  filter(runtime < 140) %>%
  filter(budget > 0) %>%
  #filter(release_date > 1980) %>%
  mutate(company = case_when(
      grepl("Studio Ghibli", production_companies) ~ "Studio Ghibli",
      grepl("Pixar", production_companies) ~ "Pixar",
      grepl("Walt Disney P", production_companies) ~ "Disney",
      grepl("DreamWorks", production_companies) ~ "DreamWorks",
      grepl("Illumination", production_companies) ~ "Illumination",
      grepl("Sony Pictures Animation", production_companies) ~ "Sony Animation",
      )
    ) %>%
  filter(company %in% Studios)

#Movie budgets
p1 <- ggplot(MOVIES_Q1_A, aes(x = reorder(title, +release_date), y = budget/1e6, fill = company)) +
  geom_bar(stat = "identity") +
  coord_flip() +
  labs(title = "Budgets",
       x = "Movies",
       y = "Budget (Millions)") +
  #geom_text(aes(label =  title), hjust = +1, color = "lightyellow") +
  scale_fill_manual(values = Studio_Colors, name = "Production Company") +
  theme(panel.background = element_rect(fill = "lightyellow"),
        panel.grid = element_blank(),
        axis.text.x = element_text(angle = 0, hjust = 0.5, size = 9, color = "black"),
        axis.text.y = element_text(angle = 0, hjust = 1, size = 9, color = "black"),
        plot.title = element_text(hjust = 0.1, size = 15)) +
  theme(legend.title = element_text(size = 12, color = "black"),
        legend.text = element_text(size = 9, color = "black"),
        legend.position = "none")

#Movie revenue
p2 <- ggplot(MOVIES_Q1_A, aes(x = reorder(title, +release_date), y = revenue/1e9, fill = company)) +
  geom_bar(stat = "identity") +
  coord_flip() +
  labs(title = "Revenue",
       x = "",
       y = "Revenue (Billions)",
       fill = "Production Company") +
  scale_fill_manual(values = Studio_Colors, name = "Production Company") +
  theme(panel.background = element_rect(fill = "lightyellow"),
        panel.grid = element_blank(),
        plot.title = element_text(hjust = 0.1, size = 15),
        axis.text.x = element_text(angle = 0, hjust = 0.5, size = 9, color = "black"),
        axis.text.y = element_blank()) +
  theme(legend.title = element_text(size = 12, color = "black"),
        legend.text = element_text(size = 9, color = "black"),
        legend.position = "top",
        legend.box = "horizontal")

#net revenue (revenue - budget)
p3 <- ggplot(MOVIES_Q1_A, aes(x = reorder(title, +release_date), y = (revenue - budget)/1e9, fill = company)) +
  geom_bar(stat = "identity") +
  coord_flip() +
  labs(title = "Net Revenue",
       x = "",
       y = "Net Revenue (Billions)") +
  #geom_text(aes(label =  title), hjust = +1, color = "lightyellow") +
  scale_fill_manual(values = Studio_Colors, name = "Production Company") +
  theme(panel.background = element_rect(fill = "lightyellow"),
        panel.grid = element_blank(),
        plot.title = element_text(hjust = 0.1, size = 15),
        axis.text.x = element_text(angle = 0, hjust = 0.5, size = 9, color = "black"),
        axis.text.y = element_blank())+
  theme(legend.title = element_text(size = 12, color = "black"),
        legend.text = element_text(size = 9, color = "black"),
        legend.position = 'none')

p1 | p2 | p3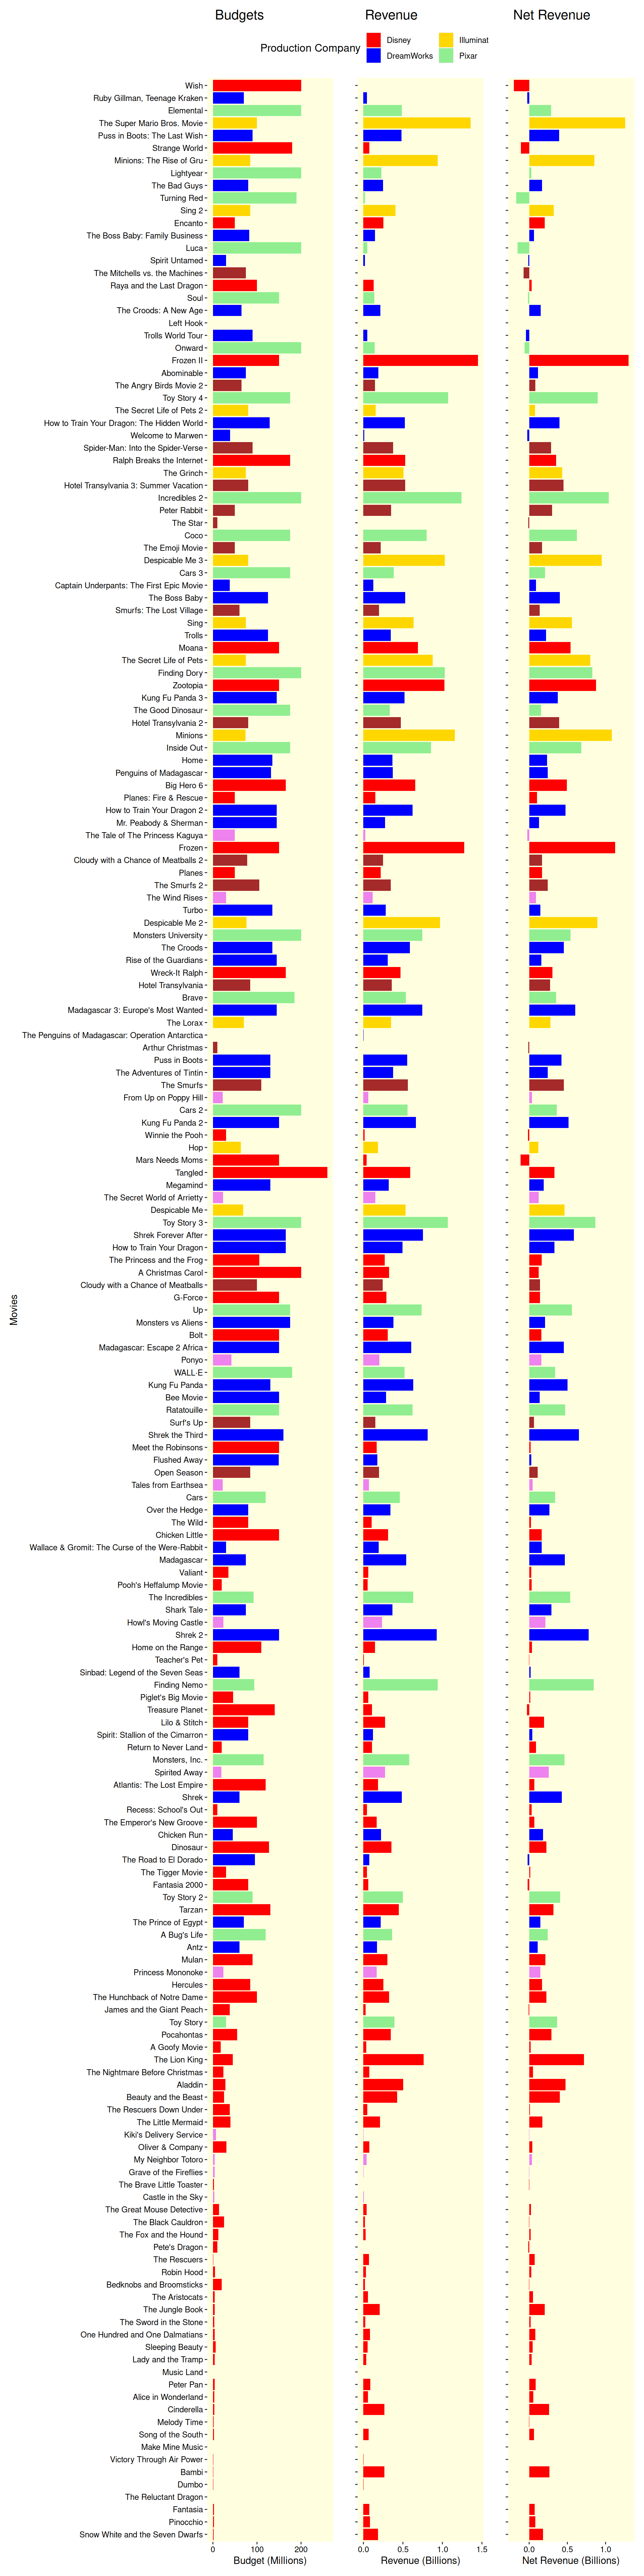
MOVIES_Q4_1 <- Animated_MOVIES %>%
  filter(!(grepl(",", production_countries))) %>%
  group_by(production_countries) %>%
  summarise(NumMovies = n())

ggplot(MOVIES_Q4_1, aes(x = production_countries, y = NumMovies, fill = NumMovies)) +
  geom_bar(stat = "identity") +
  coord_flip() +
  labs(title = "Movies by country",
       x = "Country",
       y = "Number of Movies",
       fill = "") +
  #geom_text(aes(label =  title), hjust = +1, color = "lightyellow") +
  theme(panel.background = element_rect(fill = "lightyellow"),
        panel.grid = element_blank(),
        axis.text.x = element_text(angle = 90, hjust = 0),
        plot.title = element_text(hjust = 0.1)) +
  scale_fill_gradient(low = "blue", high = "orange")+
  theme(axis.text.x = element_text(angle = 0, hjust = 0.5, size = 9, color = "black"),
        axis.text.y = element_text(angle = 0, hjust = 1, size = 9, color = "black"))+
  theme(legend.title = element_text(size = 12, color = "black"),
        legend.text = element_text(size = 9, color = "black"),
        legend.position = "bottom")
#Let's look at a grpah of movies made per year

#Grouping data by school and filtering by date and agency
#MOVIES_G8 <- Animated_MOVIES %>%
#  filter(runtime > 40) %>%
#  filter(runtime < 140) %>%
#  filter(budget > 0) %>%
  #filter(release_date > 1980) %>%
#  mutate(company = case_when(
#      grepl("Walt Disney P", Institution) ~ "Disney",
#      grepl("DreamWorks", Institution) ~ "DreamWorks",
#      grepl("Pixar", Institution) ~ "Pixar",
#      grepl("Studio Ghibli", Institution) ~ "Studio Ghibli",
#      grepl("Illumination", Institution) ~ "Illumination",
#      grepl("Sony Pictures Animation", Institution) ~ "Sony Animation",
#      )
#  ) %>%
#  group_by(company, ) %>%
# summarise(awards_count = n())#
#MOVIES_Q3_1 <- Animated_MOVIES %>%